Top 10 Linux Commands for Monitoring Your Server
As a system administrator or a power user, it’s crucial to keep a close eye on your Linux server’s performance, resource utilization, and overall health. Fortunately, Linux provides a wealth of built-in commands that can help you monitor various aspects of your server. In this blog post, we’ll explore the top 10 Linux commands that are essential for effectively monitoring your server.
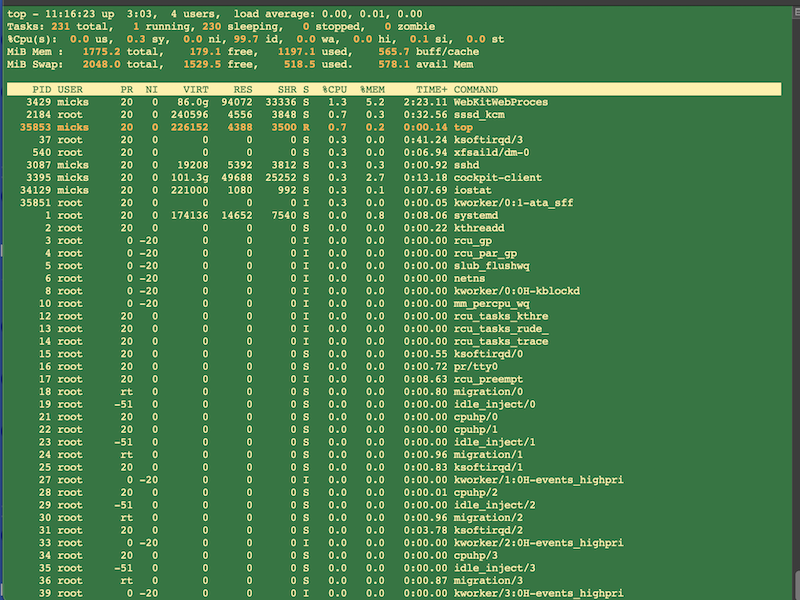
- top: This command displays a real-time view of the system’s resource usage, including CPU, memory, and running processes. It’s an excellent tool for quickly identifying resource-intensive processes and potential bottlenecks.
top- htop: Similar to
top, but with an improved user interface and additional features.htopprovides a more visually appealing and interactive way to monitor system processes.
htop- vmstat: This command reports virtual memory statistics, including information about processes, memory, paging, block I/O, traps, and CPU activity.
vmstat- sar: The System Activity Reporter (
sar) collects and reports data about the system’s activity, such as CPU, memory, disk, and network usage.
sar -u 3 5This command shows CPU utilization every 3 seconds for 5 iterations.
- iostat: This tool monitors system input/output (I/O) device loading by observing the time the devices are active in relation to their average transfer rates.
iostat -xm 5This command reports CPU, disk, and partition statistics every 5 seconds.
- netstat:
netstatdisplays network-related information, such as active connections, routing tables, and network interface statistics.
netstat -tuplnThis command shows all active TCP connections and the programs that opened them.
- df (Disk Free): This command reports the amount of available disk space on the system’s file systems.
df -hThe -h option displays disk space in a human-readable format.
- free:
freedisplays the total amount of free and used physical and swap memory on the system, as well as the buffers and caches used by the kernel.
free -mThe -m option displays memory usage in megabytes.
- lsof (List Open Files):
lsoflists information about files that are open by running processes.
lsof -i :80This command lists all processes that have opened TCP port 80 (HTTP).
- dmesg (Display Kernel Ring Buffer):
dmesgprints the kernel ring buffer, which contains messages about the system’s boot process, hardware issues, and other important events.
dmesgThese commands provide valuable insights into your server’s performance, resource utilization, and potential issues. By regularly monitoring your server using these tools, you can proactively identify and address problems before they escalate, ensuring optimal performance and stability for your Linux server.